World economic growth rates are expected to be positive in the future. One country might grow rapidly while another may experience slower growth. However, growth is never linear.
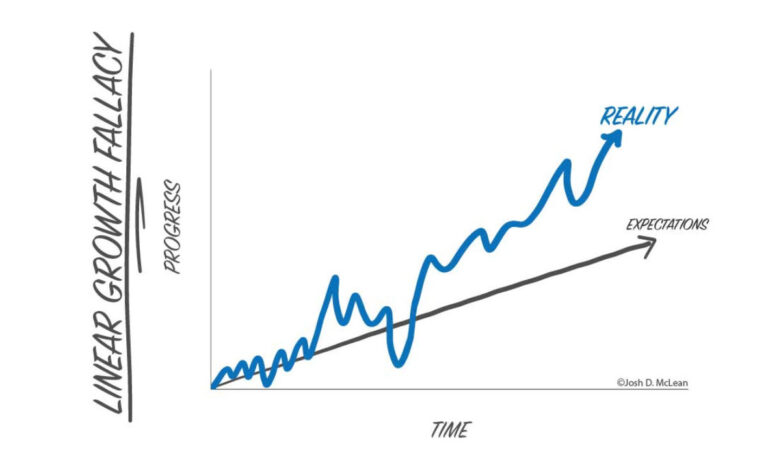
Economic growth always follows patterns and cycles—sometimes it exceeds its potential and overheats, while at other times it falls below potential. However, growth always reverts to its mean, and deviations from the trend wash out in the long run.
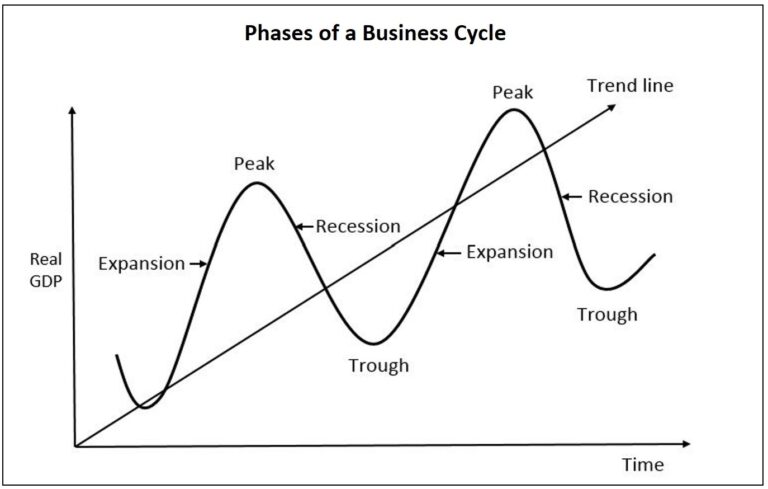
To structure this understanding, economists have come to certain conclusions and terminology. The easiest way to describe it is to consider growth rates relative to the trend line and absolute levels.
- When GDP growth is increasing, we have an Expansion that ends at Peak.
- Conversely, when GDP is declining, we are in a Recession/Contraction that ends at Trough.
When GPD is below trend line – there is an output (GDP) gap (economy is not utilizing its full potential) due to “below-trend growth / subpar growth” or severe recession.
Of course, these are just graphical representations. Let’s try to simulate real cycle.
Assumptions taken:
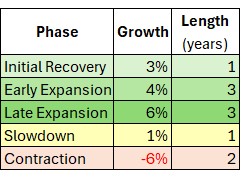
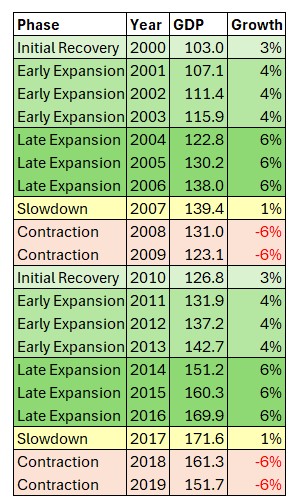
E.g. Early expansion assumed growth of GDP is 4% per year and it last 3 years
Let’s simulate two full cycles:
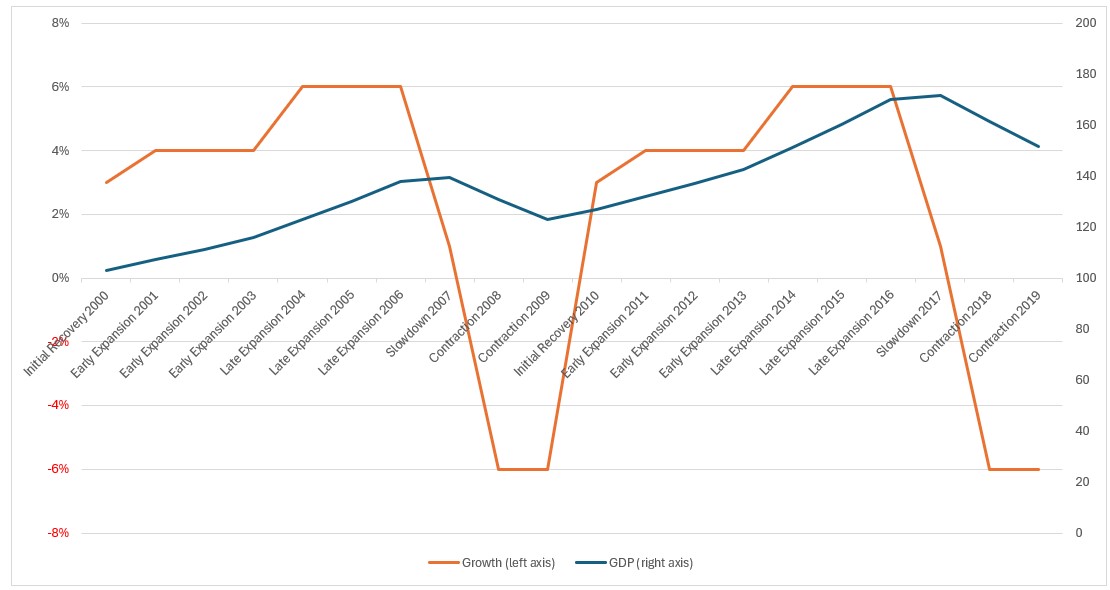
This is just explanatory; similarities are random!
Initial recovery starts in 2000, with a growth of 3%, increasing GDP from 100 to 103.
Then, we have early expansion from 2001 through 2003, with a growth of 4% each year.
We reach a slowdown in 2007 with weak growth of 1%, followed by a severe two-year contraction of 6% each year.
After the recession, we see initial recovery in 2010, and the entire process is repeated again.
Let’s present it on graph.
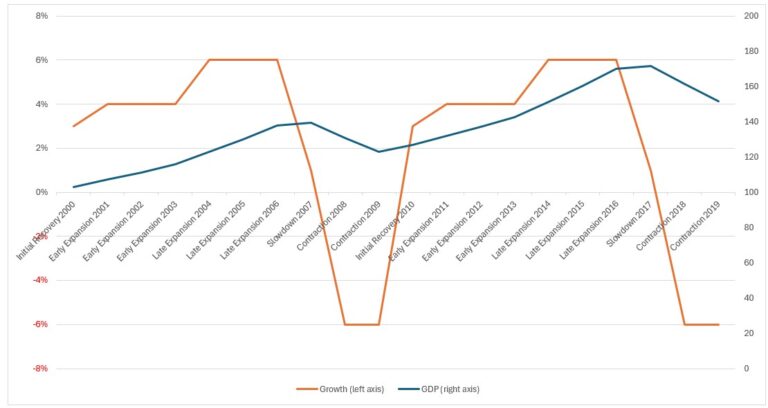
Please note, this graph is not meant to be beautiful but reliable and informative. 🙂
Why is real GDP not smoother and more closely aligned with trend GDP?
A lot of reasons and variables involved. Let’s review some of them:
- Economy is a complex environment.
- Participants make (investment) decisions based on imperfect information about current circumstances and…
- …even more uncertain expectation about future benefits.
- Many solutions are difficult to implement and…
- …costly to reverse.
- Gamechangers – disruptive innovations that changes everything in the meantime (like AI), weather patterns (like droughts and cocoa prices spike) are almost impossible to predict, geopolitical tensions (Ukraine war) or other external shocks (like Covid-19).
Even though the rules and dependencies of each phase are well-known, the process is not straightforward. The intensity and length of each phase are unpredictable. Additionally, distinguishing and identifying the current phase with certainty is challenging. Although the connections between the real economy and capital markets are well-defined, they are subject to substantial uncertainty due to the unpredictable responses of market participants. In the short term, outcomes are driven more by market reactions than by underlying real economic factors.
Storytelling: the best way to grasp the business cycle
Before we jump into facts, tables, and charts, let me tell you a story!
Part 1: Life is good
In cities across the nation, the signs of economic prosperity were evident. Businesses were thriving, new homes were being built, and consumer spending was robust. The economy was characterized by strong growth and widespread optimism.
The output gap had closed, indicating that the economy was operating at its full capacity. Factories were running at full speed, and production levels were at their peak as companies worked to meet high demand. Corporate profits were also at their highest, with businesses reinvesting their earnings into new projects and technologies, further fueling the expansion.
Unemployment was at a historic low, with almost everyone who wanted a job having one. This tight labor market led to rising wages as employers competed to attract and retain workers. Higher wages, in turn, boosted consumer confidence and spending, particularly on housing and durable goods like cars and appliances. The real estate market was booming, with homes selling quickly and prices climbing.
However, this economic boom came with signs of overheating. Inflation was rising due to increased consumer spending and higher wages, making the cost of living a growing concern. In response, the Federal Reserve began tightening monetary policy by raising short-term interest rates to curb inflation. Long-term government bond yields were also rising, but at a slower pace than short-term rates, causing the yield curve to flatten.
Credit markets were under pressure from the high levels of private sector borrowing. Consumers and businesses were taking out loans at record rates, which increased the demand for credit and put a strain on credit markets. Credit spreads for both investment-grade and high-yield bonds were falling, with a steeper decline for higher-rated bonds.
In the stock market, the mood was mixed. Share prices were rising, but volatility was increasing as investors watched for signs of a slowdown. Cyclical assets like small-cap stocks and high-yield corporate bonds were underperforming compared to inflation hedges such as commodities, which were doing well due to their appeal as a safeguard against rising prices.
Despite these concerns, business confidence remained high. Companies were eager to invest in new capacity to meet the strong demand, even as they faced rising costs and tighter credit conditions. This investment surge contributed to the risk of an overheated economy, with some warning that the boom might not last.
Debt coverage ratios, which indicate a company’s ability to service its debt, were starting to decline. As balance sheets grew and interest rates rose, managing debt became more challenging. However, corporate defaults were falling, and leverage levels were stable, indicating that most companies were handling their finances responsibly.
In this late expansion phase, the central bank aimed for a “soft landing”—slowing the economy just enough to prevent overheating without triggering a recession. Fiscal balances were improving as tax revenues increased due to strong corporate profits and high employment, giving policymakers some flexibility.
For now, people continued to enjoy the benefits of a thriving economy. Life was good, but the underlying tensions hinted at potential challenges ahead. The signs of a possible slowdown were there, but the optimism of the late expansion phase kept the momentum going.
Part 2: It’s Not the End, but It’s the Beginning of the End
As the economy transitioned from a phase of exuberant growth, the signs of a slowdown began to emerge. The once-vibrant streets and bustling markets started to lose some of their luster as the economic activity decelerated. This phase marked a critical juncture where the economy approached its peak and started to face increasing challenges.
Economic activity, which had been accelerating rapidly, began to slow. The growth rate decelerated as businesses faced rising costs and fewer viable investment opportunities. Despite the slowdown, corporate profitability remained stable, supported by past gains and careful management of expenses. However, corporate leverage was on the rise as companies continued to take on more debt, a trend that would later pose significant risks.
In this environment, business confidence wavered. The uncertainty about the future made businesses cautious about expansion and investment. Inflation continued to rise as firms, trying to stay ahead of escalating costs imposed by other firms doing the same, raised their prices. This self-perpetuating cycle of rising prices strained consumers and businesses alike.
Spending on housing and consumer durables also began to show signs of weakness. The previously red-hot real estate market cooled, and sales of big-ticket items like cars and appliances started to decline.
The Federal Reserve, in its attempt to manage the economy, had been raising short-term interest rates. These rates were now at a high level, with the possibility of further increases looming, although they were likely nearing their peak. Long-term government bond yields peaked and then began to decline sharply at the first clear signs of a slowing economy. This shift indicated that investors were anticipating lower future growth and seeking safer, long-term investments. The yield curve, reflecting these changes, showed signs of inversion, especially if the central bank maintained upward pressure on short-term rates.
In the credit markets, the situation became more challenging. Credit spreads began to widen, particularly for weaker credits. The increased borrowing costs made it harder for businesses and individuals to secure loans, exacerbating the economic slowdown. Credit default swaps, which provided protection against defaults, saw increased demand as investors grew wary of rising corporate leverage and potential defaults.
The stock market responded to the changing economic landscape with increased volatility, and share prices fell as investors reassessed their risk appetite. Interest-sensitive stocks, such as utilities and “quality” stocks with stable earnings, performed relatively well as they were seen as safer bets in uncertain times. In contrast, cyclical assets, including small stocks, high-yield corporate bonds, and emerging market equities and bonds, underperformed. This shift further signaled that the economy was entering a more precarious phase.
As the economy approached its peak, it became increasingly vulnerable to shocks. The combination of rising interest rates, fewer investment opportunities, and accumulated debt created a fragile economic environment. Any unexpected event could tip the balance and accelerate the downturn.
In summary, this phase was characterized by decelerating economic activity, stable but vulnerable corporate profitability, rising corporate leverage, and widening credit spreads. Inflation continued to rise, short-term interest rates neared their peak, and long-term bond yields declined. The yield curve showed signs of inversion, and the stock market exhibited volatility. This period marked the beginning of the end of the expansion, setting the stage for the next phase of the business cycle.
Part 3: Something Breaks
As the economy moved into the next phase, the signs of strain became unmistakable. This period typically lasts between 12 and 18 months and is characterized by a sharp decline in economic activity. The once thriving landscape now faced significant challenges as businesses, consumers, and financial markets all felt the impact of the downturn.
Economic activity declined steadily during this phase. Corporate profitability, which had been stable recently, now fell sharply. Firms were forced to cut production drastically in response to declining demand and rising costs. Investment spending, which had driven much of the previous expansion, now led the contraction as companies pulled back on new projects and capital expenditures.
Business confidence plummeted. The uncertainty and fear of worsening economic conditions caused businesses to adopt a conservative approach, further reducing investment and hiring. This lack of confidence was mirrored in the credit markets. Tightening credit conditions exacerbated the downward pressure on the economy, with credit spreads widening and remaining elevated. The availability of credit shrank as lenders grew increasingly cautious.
Unemployment rose quickly, impairing household financial positions. The rapid increase in joblessness meant that many households faced financial difficulties, leading to a significant drop in consumer spending, particularly on housing and durable goods. This decline in spending further weakened the economy, creating a vicious cycle of reduced demand and increased layoffs.
Inflation, which had been a concern recently, began to subside. With demand falling and production cuts leading to excess capacity, prices stabilized and even decreased in some sectors. The central bank responded to the confirmed recession by easing monetary policy, cutting short-term interest rates in an attempt to stimulate economic activity. Long-term government bond yields also dropped as investors sought the safety of government securities.
The yield curve steepened substantially during this phase. As short-term rates fell more rapidly than long-term rates, the difference between them increased. This steepening was a signal that the market expected economic conditions to eventually improve, even though the immediate outlook was bleak.
The stock market, which had already been volatile, declined significantly in the early stages of this phase. However, as the recession progressed, the market began to stabilize and even started to rise in the later stages, often well before the overall economy showed signs of recovery.
Credit spreads remained elevated throughout this phase, reflecting the high perceived risk in the market. Firms struggled to roll over near-term debt maturities, and many faced bankruptcy. This period was often marked by significant financial distress, including major bankruptcies, uncovered fraud, and the exposure of aggressive accounting practices.
The broader economy suffered from the cumulative effects of these challenges. With investment leading the contraction, production was cut sharply. Wages stagnated or fell as unemployment rose, further reducing consumer spending power. Debt coverage ratios deteriorated as revenues fell and interest burdens remained high, leading to increased financial distress among businesses.
Fiscal balances were strained as government revenues fell and expenditures on social safety nets rose. The central bank aimed to mitigate the impact of the recession through monetary easing, but the effectiveness of these measures often took time to manifest.
In summary, this phase was characterized by declining economic activity, falling corporate profitability, peak corporate leverage, rising defaults, and peak credit spreads. The yield curve steepened, short-term interest rates and bond yields dropped, and the stock market initially fell before beginning to recover in the later stages. This phase was marked by significant financial distress and a challenging economic environment, setting the stage for the eventual recovery.
Part 4: There’s Hope
This phase emerging from the depths of recession. This short but critical period, typically lasting a few months, is characterized by a stabilization in economic activity and a cautious optimism. The economy starts to pick up, and the worst of the downturn seems to be over.
During this phase, economic activity stabilizes as the negative output gap remains large. Businesses start to see a glimmer of hope as conditions improve slightly. Corporate profitability begins to rise from its previous lows, driven by cost-cutting measures implemented during the recession and a gradual increase in demand. Corporate leverage, which had peaked during the contraction, starts to fall as companies focus on repairing their balance sheets and reducing debt.
Despite the improving outlook, corporate defaults reach their peak. Many firms, weakened by the prolonged downturn, fail to recover in time and succumb to financial distress. This peak in defaults is a lagging indicator, reflecting the severe impact of the recession on weaker businesses.
Business confidence, however, begins to rise. With the worst seemingly behind them, companies start to plan for the future. Stimulative policies, such as low interest rates and government support programs, remain in place to support the recovery. These policies help to create a more favorable environment for growth and investment.
Inflation, which had been a concern during the slowdown, continues to decelerate. The slack in the economy, represented by the large output gap, keeps price pressures in check. As a result, short-term interest rates remain low, providing further support for economic recovery.
Long-term government bond yields also stay low and may even decline further in anticipation of continued disinflation. However, these yields are likely approaching their bottom, as the worst of the economic downturn appears to be over. The yield curve remains stable, reflecting the cautious optimism in the market.
Credit markets begin to show signs of stability. Credit spreads, which had widened significantly during the contraction, start to stabilize as investor confidence slowly returns. The credit spread slope remains stable for high-grade securities but is inverted for lower-rated credits, indicating lingering concerns about the risk of defaults among weaker companies.
The stock market responds positively to the improving conditions. Share prices rise briskly as fears of a prolonged recession or depression dissipate. Investors, encouraged by the signs of recovery, begin to pour money into the market. Cyclical assets, including small stocks, high-yield corporate bonds, and emerging market equities and bonds, outperform as risk appetite returns.
Spending on housing and consumer durables sees an upturn. With low interest rates and improved confidence, consumers feel more secure about making significant purchases. The real estate market starts to recover, and sales of durable goods pick up, contributing to the overall economic recovery.
In summary, this phase is characterized by stable economic activity, rising corporate profitability, falling corporate leverage, and peaking defaults. Business confidence improves, supported by ongoing stimulative policies. Inflation decelerates, and both short-term interest rates and long-term bond yields remain low. The stock market rises sharply as investor confidence returns, with cyclical and riskier assets performing well. This phase lays the foundation for sustained economic growth as the recovery gains momentum.
Part 5: Let’s Start Pumping It Again
As the economy transitions to this phase, it begins to gain momentum. This phase is characterized by stabilizing economic activity and a renewed sense of optimism among businesses and consumers. The phase often is seen as a period of consolidation, lays the foundation for sustained growth.
Economic activity stabilizes during this phase, with output gaps remaining negative, indicating that the economy has not yet reached its full potential. Corporate profitability rises rapidly as businesses benefit from improved demand and operational efficiencies implemented during the downturn. With rising profits, corporate leverage falls as companies prioritize paying down debt and strengthening their balance sheets. Although corporate defaults had peaked in the previous phase, they now begin to decline as the financial health of firms improves.
Unemployment starts to fall, reflecting the uptick in economic activity. Businesses, encouraged by the improving conditions, step up production and investment. This increased activity is a sign that confidence is returning to the market. Consumer borrowing and spending rise as well, driven by better job prospects and improving household financial positions. Spending on housing and consumer durables is particularly strong, further boosting economic growth.
Stimulative policies, which were critical during the recovery, begin to be withdrawn. The central bank starts to raise short-term interest rates to prevent the economy from overheating, signaling a shift from emergency measures to more normalized monetary policy. Despite this, longer-term government bond yields remain stable or rise slightly, reflecting steady investor confidence in the economic outlook. The yield curve, which had been steepening, now begins to flatten as short-term rates increase faster than long-term rates.
The stock market trends upward as investor sentiment improves. Stocks, particularly cyclical assets, continue to perform well, driven by expectations of continued economic growth. This upward trend is supported by rising corporate profits and increased business investment. The stability in credit spreads for high-grade securities contrasts with the inversion for lower-rated credits, indicating lingering caution among investors regarding riskier assets.
The overall economy gains momentum, with demand for housing and consumer durables remaining robust. This strong demand drives production increases and investment in new capacity, creating a virtuous cycle of growth. As businesses and consumers alike feel more secure, borrowing and spending continue to rise, further supporting economic expansion.
In summary, this phase is marked by stable economic activity, rapidly rising corporate profitability, falling corporate leverage, and declining defaults. Business confidence improves, supported by strong consumer spending and robust demand for housing and durables. Short-term interest rates move up as the central bank withdraws stimulus, while long-term bond yields remain stable or rise slightly. The yield curve flattens, and the stock market trends upward, driven by investor optimism. This phase sets the stage for sustained economic growth as the expansion gains strength.
Monetary Policy and Fiscal Policy
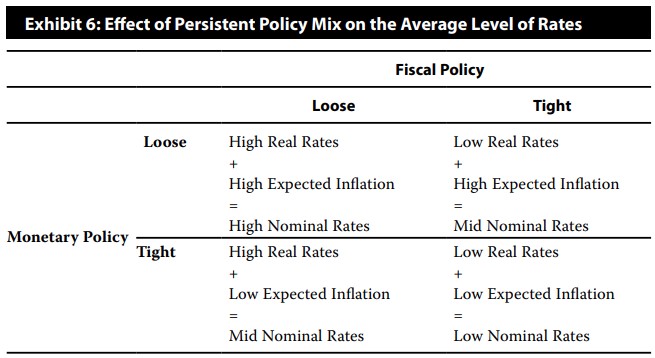
There is an informative chart in the CFAI curriculum that you should be familiar with.
Let’s take an example:
- Loose Fiscal Policy is causing real rates to be 4%, and Tight Fiscal Policy is causing real rates to be 2%.
- Loose Monetary Policy is causing real rates to be 3%, and Tight Monetary Policy is causing real rates to be 1%.
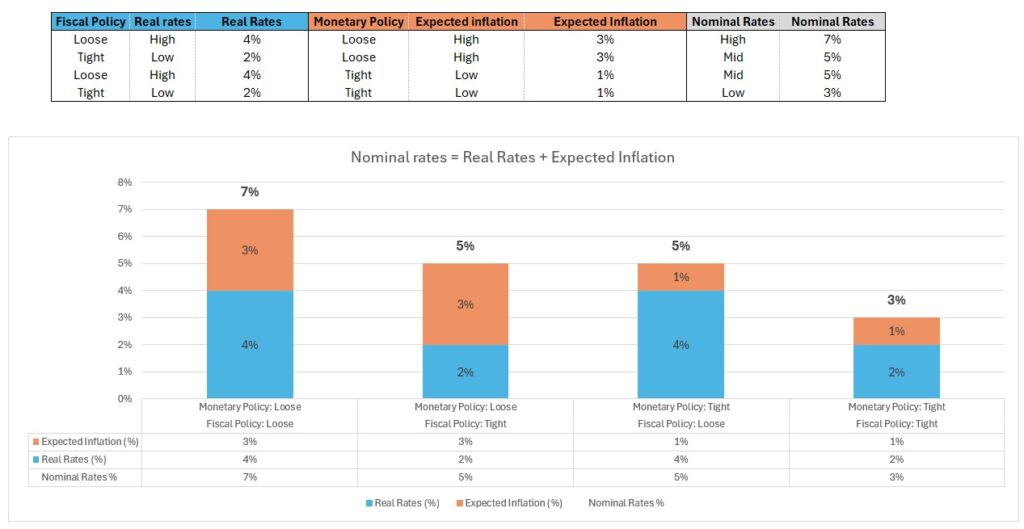
Loose policies are causing rates to be high. If we combine both loose policies, we will arrive on high nominal rates (7% in this case).
Tight policies are causing rates to be low. If we combine both tight policies, we will arrive on low nominal rates (3% in this case).
If we combine one loose and one tight policy, result on nominal rates is uncertain.
What these policies have to do with business cycle?
In general, monetary policy is countercyclical. When the output gap closes during the early stages of the “late expansion” phase, the central bank imposes increasing restrictions on the market, which involves decreasing the money supply. Simpler way is to raise rates. This includes reducing or stopping the purchase of government securities or other financial assets from the market (withdrawing Quantitative Easing) and by selling these or letting them mature (Introducing Quantitative Tightening).
Monetary policy is becoming more and more restrictive along with the booming economy. When something cracks and recession is confirmed, central banks cut rates promptly to stimulate economic growth.
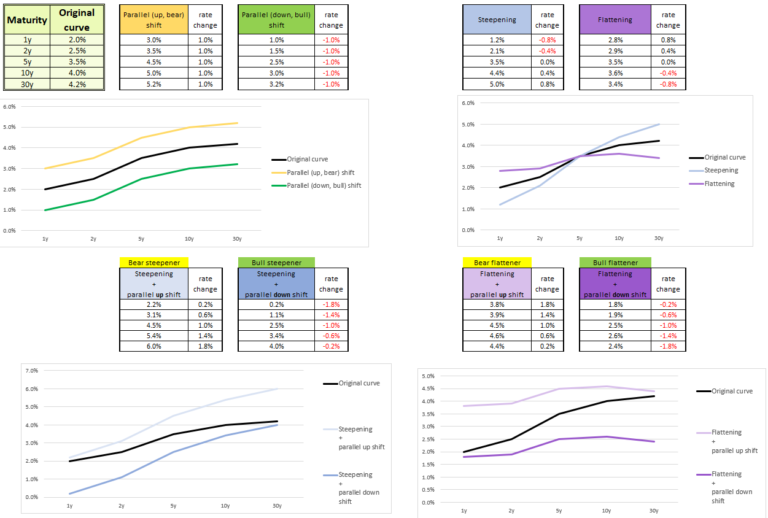
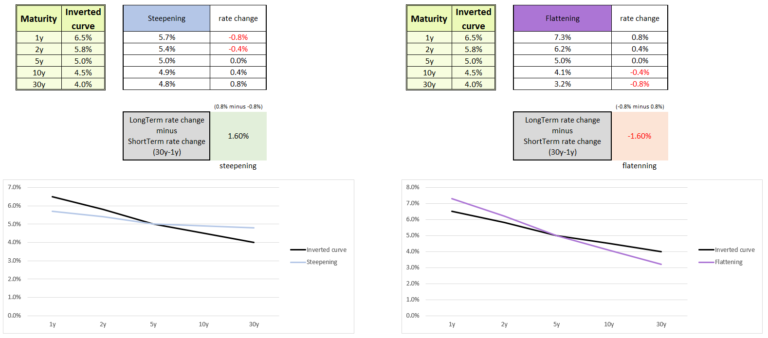
Money Market Rates (yields up to 1 year) are mostly tied to the Fed rate. Bond Yields, on the other hand, are primarily guided by the market – influenced by real rates, inflation expectations, and prospects of future growth. Recessions suppress inflation (and its expectations) and future growth prospects. Therefore, during economic slowdowns and contractions, bond yields (the long-term leg of the yield curve) decline sharply. However, long-term rates are very unlikely to drop near 0, unlike short-term rates when the Fed cuts rates to 0. This is why during slowdowns and contractions, we see a significant bull steepener move on the yield curve.
During early recovery, when Fed rates are cut to the bottom, bond yields may still slightly decline but are likely to be bottoming out – this represents a slight bull flattening move.
In the early phase of expansion, the market prices in more growth in bond yields, and the Fed may start to slightly raise its rates. Consequently, the yield curve moves upward (bear move), but its shape stays largely unchanged, perhaps slightly flattening.
During expansion, bond yields reflect increasing inflation expectations, then actual inflation, and increasingly better growth prospects. Meanwhile, the Fed raises its interest rates, leading to a bear flattening move. This cycle continues until a slowdown and recession occur, repeating the entire process.
In simplest terms, the curve tends to be steep at the bottom of the cycle, flatten during the expansion until it is very flat or even inverted at the peak, and re-steepen during the subsequent contraction.
Credit Cycle
Let’s go through this phase by phase:
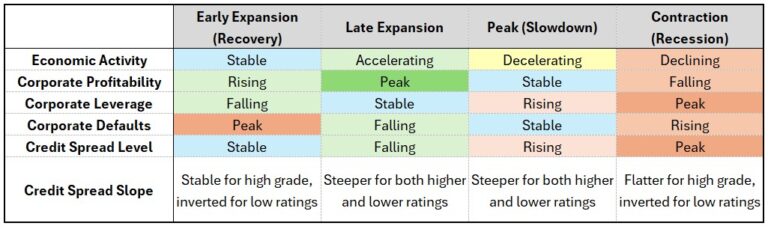
Early expansion (recovery):
- Economic activity has stopped falling and is now stable, setting the stage for future growth. Both the economy and consumers are exhausted by the recession but are ready to grow soon.
- Corporations are starting to see improvement, with increased demand and improved margins translating into rising corporate profitability.
- Corporate leverage is falling as companies generate positive profits and cash flow, allowing them to pay down debt. The credit market is still weak and relatively illiquid, with lenders showing a high aversion to risk.
- Defaults are at their peak, but the situation is improving, so bankruptcies will decrease from this point.
- Credit spreads, like economic activity, are stable and not widening anymore. The market is anticipating the bottom and is discounting the future.
- The credit spread slope is stable for investment-grade (IG) bonds but inverted for high-yield (HY) bonds, reflecting a higher credit spread in their yields. However, investors expect high-yield spreads to narrow in the long term as they strengthen.
Late expansion:
- The economy is gaining momentum, with rising economic activity driven by increasing consumer and business confidence.
- Corporate profits are at their peak just before a potential slowdown.
- There’s no issue with profits and financing, so leverage is stable.
- Companies can maintain their desired capital structure, and the economy is performing well, leading to falling defaults. It’s hard to go bankrupt when the economy is booming.
- There is increasing liquidity and risk appetite in the credit market, causing credit spreads to fall.
- Both IG and HY spreads are steep as there’s no fear in the credit market, reducing short-term spreads.
At peak:
- The economy is overheated, with too much liquidity and risk appetite. Economic activity must slow down eventually, and it’s happening now.
- Corporate profits are no longer rising (remaining stable), and there are many unproductive investments that are not paying off, often financed with debt.
- As a result, leverage starts to rise as companies take on more debt to finance growth.
- Defaults are not increasing yet but are no longer falling.
- The credit market, anticipating future problems, has already started raising credit spreads, indicating rising concerns about the sustainability of growth.
- The credit spread curve remains steep for both IG and HY bonds.
Contraction:
- Contraction is defined by declining economic activity, an inevitable and painful part of the cycle. Major problems start to surface.
- With poor investments, high debt levels, and weakening demand, corporate profits fall.
- Leverage peaks at this point as companies struggle to service their debt amid declining revenues.
- More companies fail to manage their debt, leading to increasing defaults.
- Due to all these issues, market illiquidity, and risk aversion, credit spreads also peak.
- This causes short-term HY spreads to exceed long-term ones, inverting the HY credit curve. For IG bonds, the curve only flattens (not inverts), as their yields reflect less credit premium, and at this point, the central bank has already cut rates toward zero.
Cyclicality
- Inflation is procyclical, accelerating in the later stages of the business cycle when the output gap has closed and decelerating when, during a recession or the early years afterward, there is a large output gap, which puts downward pressure on wages and prices.
- Because the cyclical pattern of inflation is well known, inflation expectations will also mirror this procyclicality.
- Long-term expectations remain stable if confidence in the central bank’s target is maintained.
- Short-term expectations align closely with actual inflation, reflecting immediate economic conditions.
- Intermediate-term expectations are blend of current and future cycle phases, showing a mix of inflation trends.
- This pattern implies a “horizon structure” of inflation expectations that is countercyclical—upward sloping at the trough of the business cycle and inverted at the peak.
- Because inflation expectations are an important component of bond yields, this countercyclical pattern is one of the reasons that the yield curve’s slope is countercyclical.
- Compensation for taking duration risk (the “term premium”) is procyclical.
- Because central banks aim to stabilize actual and expected inflation, they tend to make the real rate on cash procyclical around a long-term level consistent with their target inflation rate.
- The common theme is that central banks virtually always aim to moderate the cyclical behavior of growth and inflation, in both directions. Thus, monetary policy aims to be countercyclical.
- Progressive tax regimes imply that the effective tax rate on the private sector is pro-cyclical—rising as the economy expands and falling as the economy contracts. In an expansion, as people earn more money, they pay higher taxes because they fall into higher tax brackets.
- Similarly to effective tax rate, means-based transfer payments* are pro-cyclical and vary inversely with the economy, helping to mitigate fluctuations in disposable income for the most vulnerable households. The effect of these so-called automatic stabilizers should not be overlooked in setting expectations for the economy and the markets.
*”Means-based transfer payments” refer to financial assistance programs that are provided based on the recipient’s income or financial need. These payments are designed to support individuals or households whose income falls below a certain threshold. Common examples of means-based transfer payments include unemployment benefits, food stamps (Supplemental Nutrition Assistance Program), Medicaid, and other social welfare programs.
Like progressive taxes, means-based transfer payments act as automatic stabilizers in the economy. When the economy contracts and incomes fall, more people qualify for these transfer payments, increasing the support to those in need. Conversely, when the economy expands and incomes rise, fewer people qualify for these benefits, reducing the payments. This inverse relationship helps to stabilize disposable income for the most vulnerable households, thereby reducing the overall economic fluctuations.
Join the Conversation
I encourage you to engage by commenting the post and sharing with your fellow CFA candidates. Your participation helps create a vibrant learning community where we can all benefit from shared knowledge and experiences.
Stay tuned for the next articles!